Add off-cpu profiler #1462

Merged
fyrchik merged 1 commit from dstepanov-yadro/frostfs-node:feat/off_cpu_profiler into master 2024-10-31 11:20:23 +00:00

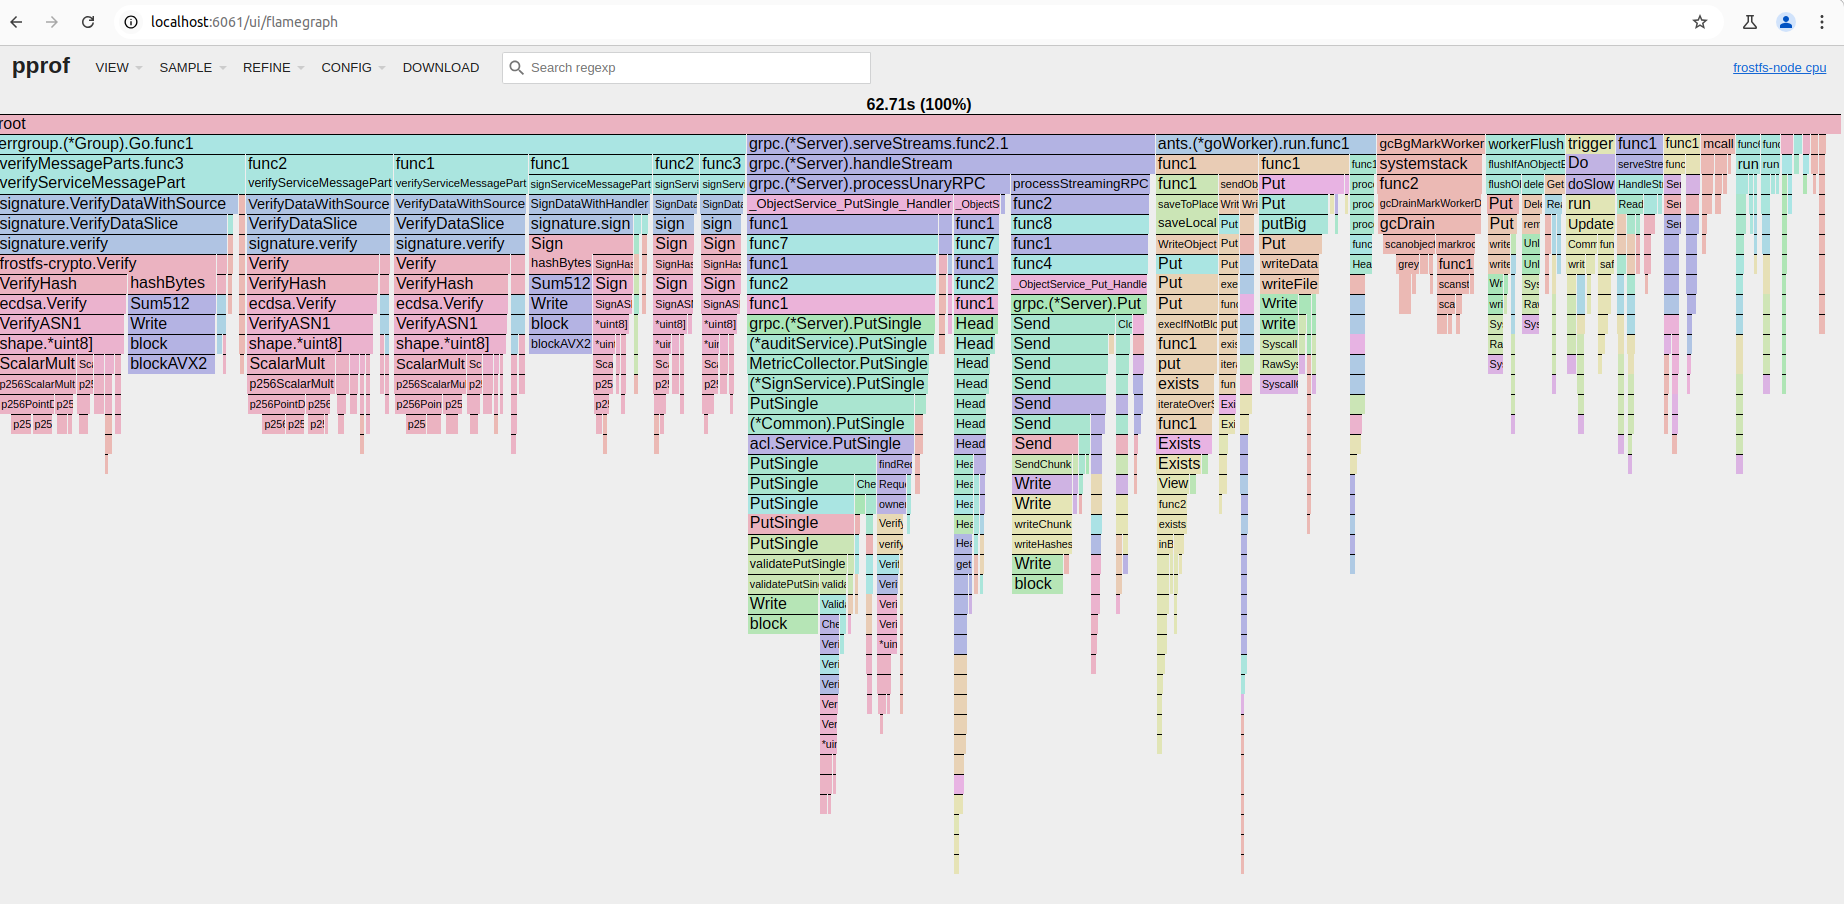
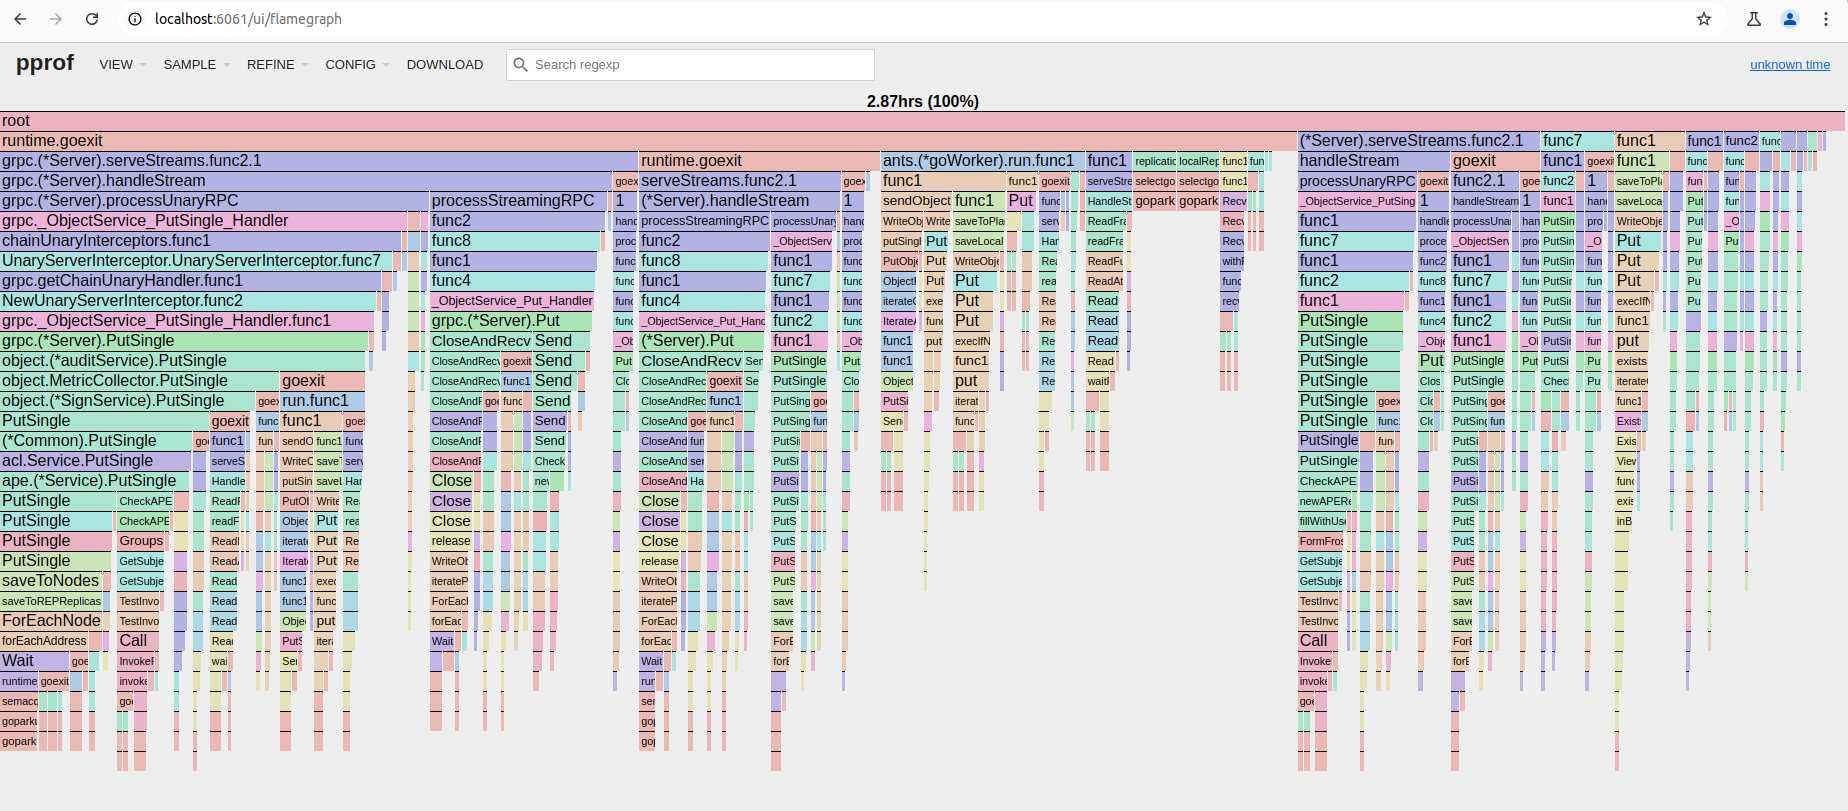
Default golang profiler is on-cpu profiler, so it shows only on CPU time. But for performance testing it is required sometimes to see distribution for all payloads: cpu and i/o.

Comparison with master on 5 min write tests for 8KB, 128KB, 1MB:
master:

8KB - 24MB/s
128KB - 637MB/s
1MB - 1.1GB/s

branch:

8KB - 28MB/s
128KB - 595MB/s, 671MB/s
1MB - 1.1GB/s

Examples:
default profiler: image
off-cpu profiler: image

The main tradeoff is performance: off-cpu profiler has greater impact on app performance

Tested on hardware (10 min, 600 VUS, 8kb write):

without profile collect:

     data_received..............: 0 B     0 B/s
     data_sent..................: 27 GB   45 MB/s
     frostfs_obj_put_bytes......: 27 GB   45 MB/s
     frostfs_obj_put_duration...: avg=107.6ms  min=9.02ms   med=88.8ms  max=1.38s p(90)=188.41ms p(95)=234.86ms
     frostfs_obj_put_success....: 3321383 5534.547481/s
     iteration_duration.........: avg=108.36ms min=137.54µs med=89.52ms max=1.38s p(90)=189.28ms p(95)=235.74ms
     iterations.................: 3321383 5534.547481/s
     vus........................: 600     min=600       max=600

with collecting profile every 10s for 3s:

     data_received..............: 0 B     0 B/s
     data_sent..................: 31 GB   51 MB/s
     frostfs_obj_put_bytes......: 31 GB   51 MB/s
     frostfs_obj_put_duration...: avg=95.31ms min=8.67ms   med=84.86ms max=814.88ms p(90)=149.47ms p(95)=181.2ms 
     frostfs_obj_put_success....: 3746615 6242.791241/s
     iteration_duration.........: avg=96.06ms min=133.46µs med=85.59ms max=815.49ms p(90)=150.27ms p(95)=182.01ms
     iterations.................: 3746615 6242.791241/s
     vus........................: 600     min=600       max=600

Perhaps the profile collecting effect shows intesf at a higher load.

5 min, 1000VUS, write 8KB
without profile collecting - 55MB/s
with profile collecting for 3 second every 10 seconds - 49MB/s

Default golang profiler is on-cpu profiler, so it shows only on CPU time. But for performance testing it is required sometimes to see distribution for all payloads: cpu and i/o. Comparison with master on 5 min write tests for 8KB, 128KB, 1MB: master: ``` 8KB - 24MB/s 128KB - 637MB/s 1MB - 1.1GB/s ``` branch: ``` 8KB - 28MB/s 128KB - 595MB/s, 671MB/s 1MB - 1.1GB/s ``` Examples: default profiler: ![image](/attachments/1ab305a9-0328-4bf2-917e-ece2bffc0e47) off-cpu profiler: ![image](/attachments/08f07a40-5931-415b-85b4-55242b679042) The main tradeoff is performance: off-cpu profiler has greater impact on app performance Tested on hardware (10 min, 600 VUS, 8kb write): without profile collect: ``` data_received..............: 0 B 0 B/s data_sent..................: 27 GB 45 MB/s frostfs_obj_put_bytes......: 27 GB 45 MB/s frostfs_obj_put_duration...: avg=107.6ms min=9.02ms med=88.8ms max=1.38s p(90)=188.41ms p(95)=234.86ms frostfs_obj_put_success....: 3321383 5534.547481/s iteration_duration.........: avg=108.36ms min=137.54µs med=89.52ms max=1.38s p(90)=189.28ms p(95)=235.74ms iterations.................: 3321383 5534.547481/s vus........................: 600 min=600 max=600 ``` with collecting profile every 10s for 3s: ``` data_received..............: 0 B 0 B/s data_sent..................: 31 GB 51 MB/s frostfs_obj_put_bytes......: 31 GB 51 MB/s frostfs_obj_put_duration...: avg=95.31ms min=8.67ms med=84.86ms max=814.88ms p(90)=149.47ms p(95)=181.2ms frostfs_obj_put_success....: 3746615 6242.791241/s iteration_duration.........: avg=96.06ms min=133.46µs med=85.59ms max=815.49ms p(90)=150.27ms p(95)=182.01ms iterations.................: 3746615 6242.791241/s vus........................: 600 min=600 max=600 ``` Perhaps the profile collecting effect shows intesf at a higher load. 5 min, 1000VUS, write 8KB without profile collecting - 55MB/s with profile collecting for 3 second every 10 seconds - 49MB/s
279 KiB
320 KiB
dstepanov-yadro added 1 commit 2024-10-30 13:48:18 +00:00
[#9999] node: Add off-cpu profiler
All checks were successful
DCO action / DCO (pull_request) Successful in 51s
Tests and linters / Run gofumpt (pull_request) Successful in 2m39s
Vulncheck / Vulncheck (pull_request) Successful in 3m4s
Pre-commit hooks / Pre-commit (pull_request) Successful in 3m46s
Tests and linters / Staticcheck (pull_request) Successful in 3m49s
Build / Build Components (pull_request) Successful in 3m55s
Tests and linters / Lint (pull_request) Successful in 4m34s
Tests and linters / gopls check (pull_request) Successful in 5m3s
Tests and linters / Tests (pull_request) Successful in 7m21s
Tests and linters / Tests with -race (pull_request) Successful in 7m22s
33318bf58c
Signed-off-by: Dmitrii Stepanov <d.stepanov@yadro.com>
dstepanov-yadro force-pushed feat/off_cpu_profiler from 33318bf58c to 3bf5862d09 2024-10-30 13:51:05 +00:00 Compare
Owner

The overhead of fgprof increases with the number of active goroutines (including those waiting on I/O, Channels, Locks, etc.) executed by your program. If your program typically has less than 1000 active goroutines, you shouldn't have much to worry about. However, at 10k or more goroutines fgprof might start to cause some noticeable overhead.

Seems like our case. 2 questions:

  1. Even when profiling is enabled, the overhead is 0, unless we are in a process of collecting profile, right?
  2. The numbers you provide are taken, while collecting the profile, right?
>The overhead of fgprof increases with the number of active goroutines (including those waiting on I/O, Channels, Locks, etc.) executed by your program. If your program typically has less than 1000 active goroutines, you shouldn't have much to worry about. However, at 10k or more goroutines fgprof might start to cause some noticeable overhead. Seems like our case. 2 questions: 1. Even when profiling is enabled, the overhead is 0, unless we are in a process of collecting profile, right? 2. The numbers you provide are taken, while collecting the profile, right?
Author
Member

The overhead of fgprof increases with the number of active goroutines (including those waiting on I/O, Channels, Locks, etc.) executed by your program. If your program typically has less than 1000 active goroutines, you shouldn't have much to worry about. However, at 10k or more goroutines fgprof might start to cause some noticeable overhead.

Seems like our case. 2 questions:

  1. Even when profiling is enabled, the overhead is 0, unless we are in a process of collecting profile, right?
  2. The numbers you provide are taken, while collecting the profile, right?
  1. As far as I understand yes: fgprof.Handler() collects goroutines stacks only when profile collect is in progress
  2. No. This is because PR has WIP prefix: I'm going to run profile collection tests soon.
> >The overhead of fgprof increases with the number of active goroutines (including those waiting on I/O, Channels, Locks, etc.) executed by your program. If your program typically has less than 1000 active goroutines, you shouldn't have much to worry about. However, at 10k or more goroutines fgprof might start to cause some noticeable overhead. > > Seems like our case. 2 questions: > 1. Even when profiling is enabled, the overhead is 0, unless we are in a process of collecting profile, right? > 2. The numbers you provide are taken, while collecting the profile, right? 1. As far as I understand yes: `fgprof.Handler()` collects goroutines stacks only when profile collect is in progress 2. No. This is because PR has WIP prefix: I'm going to run profile collection tests soon.
dstepanov-yadro force-pushed feat/off_cpu_profiler from 3bf5862d09 to d19ab43500 2024-10-31 08:32:42 +00:00 Compare
Author
Member

The overhead of fgprof increases with the number of active goroutines (including those waiting on I/O, Channels, Locks, etc.) executed by your program. If your program typically has less than 1000 active goroutines, you shouldn't have much to worry about. However, at 10k or more goroutines fgprof might start to cause some noticeable overhead.

Seems like our case. 2 questions:

  1. Even when profiling is enabled, the overhead is 0, unless we are in a process of collecting profile, right?
  2. The numbers you provide are taken, while collecting the profile, right?
  1. Performed additional tests, result in description.
> >The overhead of fgprof increases with the number of active goroutines (including those waiting on I/O, Channels, Locks, etc.) executed by your program. If your program typically has less than 1000 active goroutines, you shouldn't have much to worry about. However, at 10k or more goroutines fgprof might start to cause some noticeable overhead. > > Seems like our case. 2 questions: > 1. Even when profiling is enabled, the overhead is 0, unless we are in a process of collecting profile, right? > 2. The numbers you provide are taken, while collecting the profile, right? 2. Performed additional tests, result in description.
dstepanov-yadro changed title from WIP: Add off-cpu profiler to Add off-cpu profiler 2024-10-31 08:41:16 +00:00
dstepanov-yadro requested review from storage-core-committers 2024-10-31 08:41:32 +00:00
dstepanov-yadro requested review from storage-core-developers 2024-10-31 08:41:32 +00:00
acid-ant approved these changes 2024-10-31 08:49:36 +00:00
aarifullin approved these changes 2024-10-31 09:09:14 +00:00
fyrchik merged commit d19ab43500 into master 2024-10-31 11:20:23 +00:00
fyrchik referenced this pull request from a commit 2024-10-31 11:20:24 +00:00
Sign in to join this conversation.
No reviewers
No milestone
No project
No assignees
4 participants
Notifications
Due date
The due date is invalid or out of range. Please use the format "yyyy-mm-dd".

No due date set.

Dependencies

No dependencies set.

Reference: TrueCloudLab/frostfs-node#1462
No description provided.